Slopes Diaries #7: So How's That Going For You?
Slopes Diaries is my ongoing journey to turn my indie app into a more sustainable part of my business. First time reading? Catch up on the journey so far.
What is Slopes? Think Nike+, Runkeeper, Strava, MapMyRun, etc for skiers and snowboarders.
Best part about being post-launch? This stops being theory. I have numbers to share about the first week of 2.0.
Holy Downloads Batman
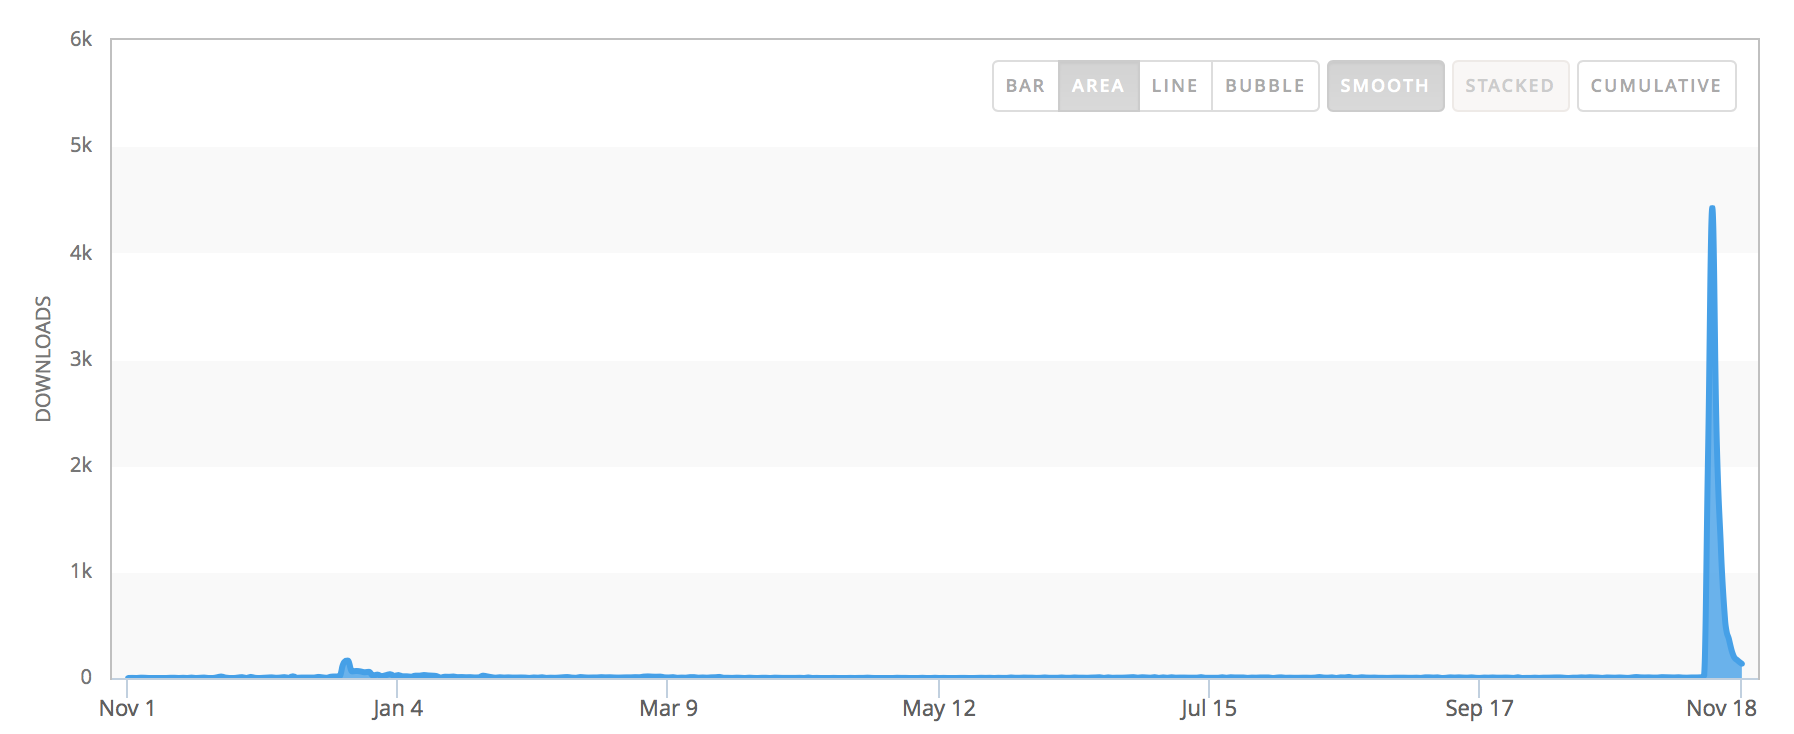
I swear, I used to actually have downloads, despite what this chart makes it look like.
That little blip you see about a year ago was my best new-version-hype I got as a paid up front app. 164 downloads in a day because I got a mention on TUAW for the launch of v1.4 (I'd say the long-tail of that mention got me another 120 or so).
Slopes 2 launched with minimal press coverage, despite my best efforts. I'm not very well connected into that group, and the press is busy with a lot of people asking for their attention. I think the business model change makes an interesting story, but the app itself doesn't stand out with a story of it's own (or I might just be a terrible storyteller).
Anywho, on launch day, most of the coverage was:
- I had a quick mention at iMore that converted to 6 downloads, according to App Store Analytics (so, given the limited tracking of Analytics, lets say 100 downloads?).
- Product Hunt (again, 6 reported downloads)
- I always post major app updates to /r/snowboarding and /r/skiing on Reddit (63 reported downloads)
- Twitter friends supporting me (thanks!)
- A link or two through Flipboard
Over the last year leading up to my launch my average downloads per day was 5.5. The first week of downloads now that I'm free looked like this:
Day 1: 2,100 downloads, 380x avg (over a year's worth of downloads in a day!)
Day 2: 4,400 downloads, 800x avg
Day 3: 2,300 downloads, 418x avg
Day 4: 1,262 downloads, 229x avg
Day 5: 558 downloads, 101x avg
Day 6: 356 downloads, 65x avg
Day 7: 211 downloads, 38x avg
That day two spike had me confused for a moment, I thought it might have been top-chart caused (I did get into the top 50 for sports). I did some digging and found something I hadn't considered.
On that day, two sites that track app sales picked up on the price change and reported Slopes as "on sale". An article on BGR w/ about a half-dozen other apps going on sale in which Slopes was included, and a similar callout on AppShopper, got me a combined 500 reported units downloaded in iTunes Analytics. Now, neither of these sites actually covered the app itself in detail (calling out features / etc) so those downloads on day two and three are largely made up by people just grabbing Slopes while it's "on sale".
I shipped Slopes 2 with Fabric. On day two I noticed iTC reported a ton of downloads, but Fabric only reported about half as many new users. That means that half of the 4,400 people that downloaded on day two didn't even bother to launch the app. Certainly lines up with my expectation of users from those traffic sources.
I don't think I'll get many paid customers from that group, but it's some interesting free potential word-of-mouth I hadn't planned on. Really glad I could put that picture together between Fabric and App Store Analytics.
Since the launch spike it seems Slopes is settling in around 100-200 downloads per day (20x - 40x original numbers).
A Wider Funnel
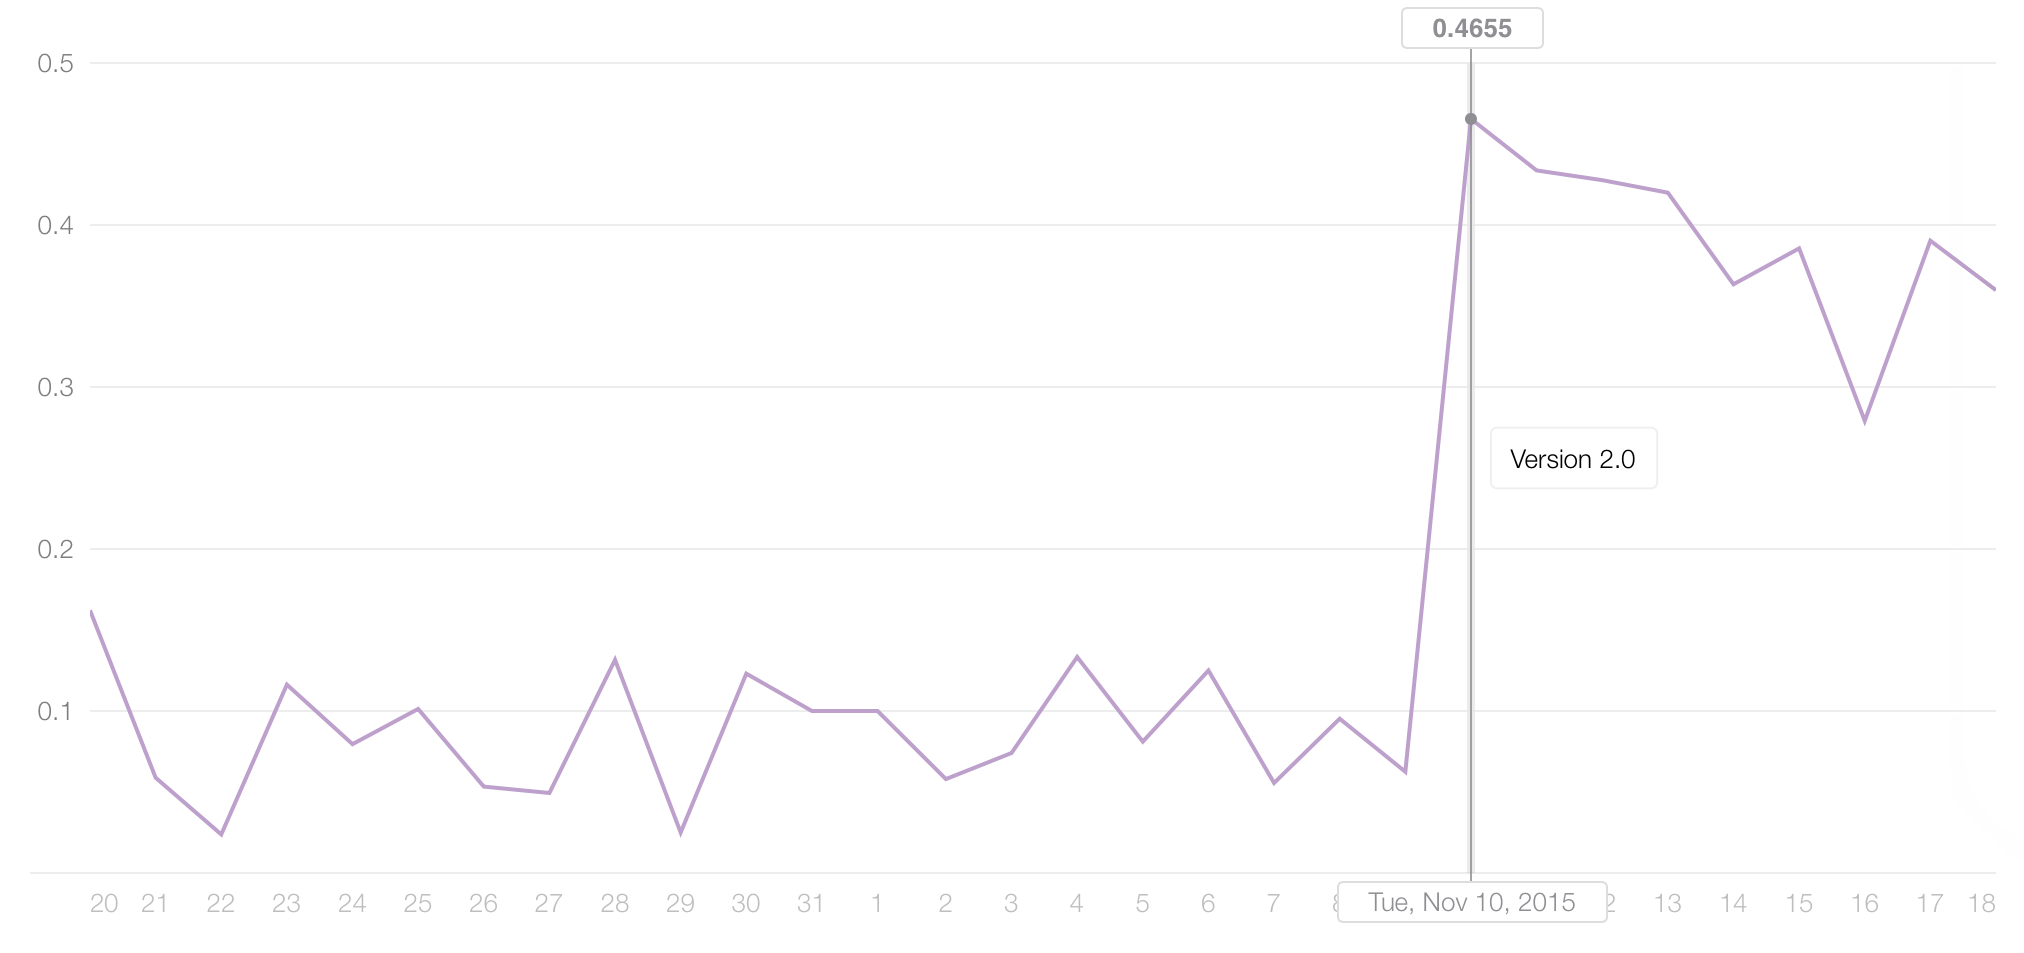
Another metric I like to look at ever since David Barnard pointed me towards it[1] is the conversion rate of a user viewing my app store page to them pressing install. In its last 90 days as a paid app Slopes had an average ratio of 0.0709 (a 1.0 ratio would be best here, 1 download for every page view).
In the first week as a free app that number is averaging 0.4237. Users are 6x more likely to play with my app now. I think it's safe to say going free certainly did remove a large barrier to acquiring potential customers.
I'm much happier trying to convert them to paying customers when I can do so in-app (subscription), vs through the App Store page (paid up front). I've always shipped with a day's worth of sample data for users to play with until they can hit the mountain and record their own data, so I'm ready to take advantage of these additional downloads to drive better conversions.
What About Revenue?
Slopes 1 had a lifetime average daily revenue of $13, and a $20/day average for the last 90 days it was sold as a paid up front app.
Slopes 2 is making an average of $12/day since launch. So it's running at 60% efficiency, compared to where I would have been revenue-wise if I left Slopes as a paid up front app.
Actually, 60% is a little higher than I expected, given the season hasn't even started yet (it was 62 degrees in PA yesterday). The real need to buy a Season Pass is going to hit users once they have more than one day recorded. I expect that my revenue comparison might lower a bit to 50% of what it used to be over the next month, then finally picking up when the season starts for most people in Dec / Jan.
Another factor that I expected would cause initial low revenue is that existing v1 users were grandfathered some v2 features for free (my rule of thumb: if it felt like they'd be "charged again just to keep what they bought in v1", I made it free for them). The v1 user base is made up of the kind of people who were willing to pay $8 for an app w/o a free trial, so they're likely to also be willing to place value on the $20/yr subscription. So right now my old user base has almost no reason to subscribe; all these subscriptions are (likely) coming new users.
Over the winter I'm focusing on adding awesome additional features for Season Pass holders that'll make them want to convert.
Still, seems like things are off to a promising start.